.png)
Financial planning and analysis (FP&A) teams regularly need to answer complex questions: What if we increase prices by 5% but volume declines by 3%? How do different marketing investments affect revenue across regions? What's the optimal product mix given capacity constraints?
Modern data platforms like Databricks make it easier than ever to explore large datasets to answer these questions. However, even if the data platform has evolved, the finance operating model often has not. Excel remains deeply embedded in day-to-day financial operations of many organizations. Critical budgeting workflows may rely on macros; reports have been built around standardized workbooks; and approval processes, audit trails, and downstream models depend on long-standing Excel logic.
This reliance on Excel creates a challenge. Traditional Excel-based modeling and analysis faces limitations when working with large datasets. Complex models either require significant simplification (losing accuracy in the process) or become too slow to be practical. Teams often resort to building models on aggregated data, which can miss important patterns that only emerge at more granular levels.
Rather than replacing Excel, a more scalable approach combines Excel and Databricks in a complementary way: Excel manages assumptions and presents results, while Databricks handles computationally heavy calculations across full datasets. This lets finance teams analyze datasets that far exceed Excel's row limits, run compute-intensive models against granular data, and maintain a single source of truth without ditching Excel.
This post explores how the Excel-Databricks connection works, how to implement parameter-driven querying using Excel and Databricks together, and considerations for implementation.
The Databricks-Excel Connector
Databricks offers an Excel add-in that establishes a connection to a Databricks SQL Warehouse. This connection enables Excel to query data stored in the lakehouse without downloading entire datasets.
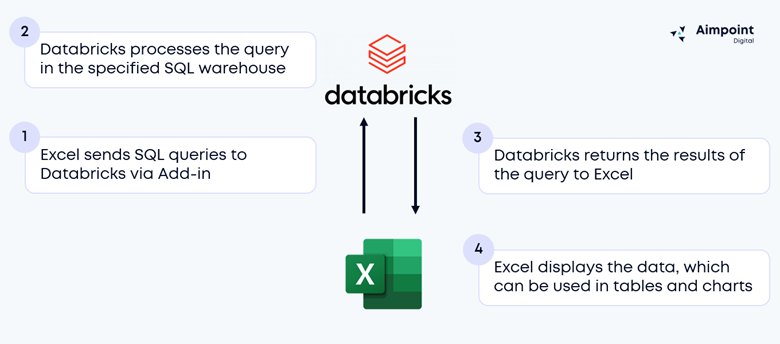
During query setup, a user can provide custom SQL, which will execute in Databricks rather than in Excel. Query processing happens in the SQL warehouse selected in the add-in. For complete setup instructions, see Connect to Databricks from Microsoft Excel | Databricks.
Analysts can pull in curated gold tables from their Databricks lakehouse and/or can construct their own custom SQL queries. With the custom SQL option, analysts can even pass parameters to those queries. These variables can reference specific cells in an Excel workbook, enabling fully dynamic analyses.
In Practice
Consider a retail finance team analyzing monthly performance across 250 stores with approximately 50 million transactions. Without the Databricks-Excel connector, Excel wouldn’t be able to process the 50 million transactions.
Aggregated View
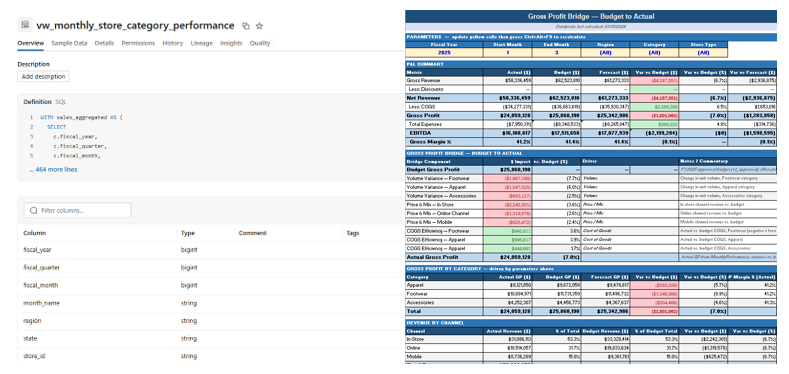
With the connector, users can retrieve a view of the data from the gold layer that returns a much smaller dataset of 20,000 rows aggregated by month, store, and category:
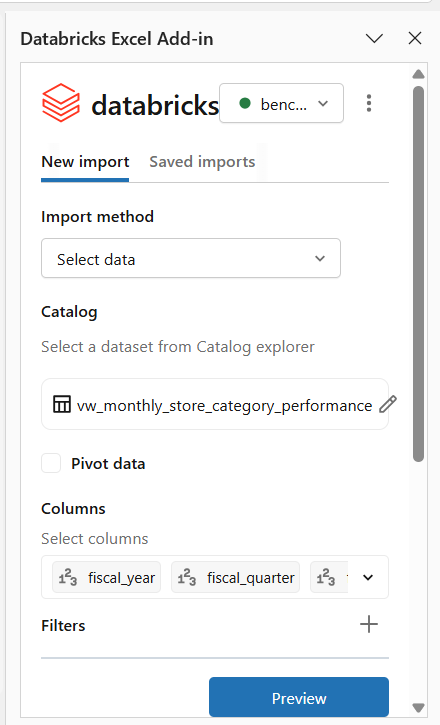
Because the view’s underlying SQL executes in Databricks, the Excel file stays small and responsive while still reflecting live data. Analysts can then reference the results of this query to perform additional analyses and create formatted reports within Excel.
Parameterized SQL Query
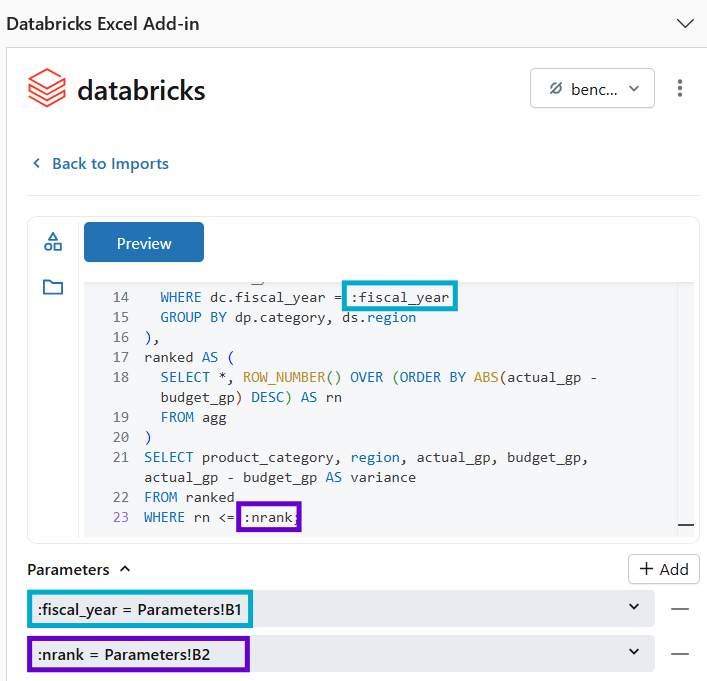
Now consider the team wants to identify which product categories are most significantly over or under their gross profit targets for a given time period. There is no available gold table or view that contains this information, so the team must use a custom SQL query.
The analysts can use the Excel add-in to run a custom SQL query that joins raw sales transactions with the budget plan directly in Databricks, returning only the top N categories by gross profit variance. To change the scope of the analysis, the analyst would only need to update the parameter input cells and refresh the query.
This same pattern can be applied to much more complex use cases, such as computing customer lifetime value across millions of customers, calculating multi-year transaction-level P&L attribution, modeling financial scenarios against the full product catalog and historical volume data, and more. The add-in supports calling metric views and stored procedures, which can be parameterized for a high degree of flexibility.
Designing for Scalable Excel Workloads
A successful Excel-Databricks integration requires thoughtful architectural decisions.
Designing Databricks Queries
Pre-aggregation: The foundation of good Excel-Databricks performance is pre-aggregation. Rather than querying fact tables with millions or billions of rows directly, teams should create aggregated views that summarize data to the level needed for analysis.
Parameter design: We recommend keeping parameter lists manageable. For complex scenarios with many variables, consider using configuration tables in Databricks that Excel references or creating preset scenarios that Excel calls by name.
Return structure: Excel is not designed to handle millions of rows. Analysts should ensure their queries return a smaller set of data by aggregating and/or filtering the data.
Optimizing Performance
Partitioning and clustering: For fact tables storing large transaction volumes, we recommend partitioning by date and clustering by frequently filtered columns. This enables Databricks to skip irrelevant data partitions, reducing query time and compute costs. Even better, leverage Databricks native features like liquid clustering and managed tables.
SQL warehouse configuration: Databricks SQL Warehouses auto-scale based on query load. For Excel analytics workloads, we recommend using serverless warehouses, which provide faster startup times and are often more cost-effective for variable workloads. We recommend starting with a smaller warehouse size, monitoring usage, and scaling to a larger warehouse size if needed.
Enforcing Access Restrictions
When finance teams share analytical workbooks across an organization, access control becomes critical. A CFO needs visibility into all regions, while regional VPs should see only their assigned territories and store managers should access only their individual locations. Traditional Excel security mechanisms like worksheet protection, file passwords, or separate file versions create significant maintenance overhead.
Databricks Unity Catalog addresses this through a layered set of access controls enforced at the database level, independent of the query tool. These controls include table and column-level privileges, column masks to redact or transform sensitive values for unauthorized users, and row filters to restrict which records a user can see based on their identity or group membership. When a user queries a table, Databricks automatically applies all relevant filters and masks, so a store manager querying the same table as a CFO will see only their location's rows and any sensitive columns will be appropriately obscured. See Row filters and column masks | Databricks.
Because these controls operate at the data source, they apply consistently regardless of whether the query originates from Excel, Python, SQL, or a BI tool. The Excel Add-in connector uses OAuth to let Databricks know which user is accessing the data and therefore apply the restriction accordingly. This approach ensures consistent access enforcement, full auditability, immediate permission updates across all tools, and stronger support for regulatory compliance.
To take full advantage of these controls, remove the imported data from the file before sharing with others, and have the end user refresh the data query themselves. This ensures that security filters are applied and that sensitive data is not persisted in the file itself.
Moving Beyond Excel
The Databricks–Excel connector is a powerful starting point, but it doesn’t have to be the end state. For teams looking to expand their analytics capabilities, Databricks Genie allows analysts to query their lakehouse data using natural language, making ad hoc analysis accessible without writing SQL. Going back to our example from earlier, our finance team could use Genie’s chat interface to ask which 5 product categories are most significantly over or under their gross profit targets for Q4. Genie will return the results along with the underlying SQL code so the analyst can verify the analysis.
For teams that need to write data back to the lakehouse (e.g., updating forecasts, logging assumptions, or submitting plan adjustments), Sigma offers an Excel-like front-end (without Excel’s row limits) for building data apps that can both read data from and write data back to Databricks.
Conclusion
Finance teams have long faced an implicit tradeoff: stay in Excel and sacrifice scale or move to more powerful tools and disrupt established workflows. The Excel–Databricks connection removes that constraint.
Analysts can continue working in familiar Excel environments, while Databricks manages large data volumes, complex transformations, and enterprise-grade security at the data layer. Performance and governance improve, and finance teams spend less time managing data limitations.
Operating on a governed lakehouse foundation also creates flexibility for the future. Excel becomes one access point to trusted data rather than the only one. Natural language chat interfaces via Databricks One, Sigma data applications with write-back capabilities, and advanced analytics can all build on the data models.
At Aimpoint Digital, our team partners with organizations of all sizes to enable self-service analytics and tackle complex use cases. If you would like to learn more about our services and offerings, please reach out and we would be happy to discuss how our expertise can support your needs.
.png)