In the first post, we argued that natural-language analytics fails less because models cannot write SQL, and more because organizations have not enriched their data with meaning and context. A warehouse can be well governed and still be hard to interpret. A BI model helps, but it is designed for deterministic dashboards, not for an agent that must translate loosely phrased questions into precise queries and still get the meaning right.
This post is the practical counterpart. An AI-ready semantic layer is not an abstract idea or a vendor feature. It is a set of concrete artifacts you can inspect, version, and improve. The clearest way to see it is to follow a single business question through the three layers we introduced: raw data, a BI-ready model, and the AI-ready semantic layer that makes the same data interpretable for an agent.
A single concept, viewed through three layers
Consider a retail business. An executive asks: “Are beverage margins slipping in Northeast Express stores?”. It sounds like a straightforward KPI with a couple of filters.
In most organizations, it is not.
To answer that question well, an agent has to combine transaction facts, product hierarchy, and store attributes. It also has to make the same interpretive choices a good analyst would make: what “margin” means, which product hierarchy defines “beverage”, which store attributes are authoritative, and what time comparison makes “slipping” meaningful.
Layer 1: Raw data (what source systems record)
Below is the kind of operational data a company might have. It is representative rather than exhaustive, but it mirrors what shows up in real warehouses: a transaction table, a store master, and a product master.
Sales_transactions
Stores
Products
Does “margin” mean gross profit dollars or gross margin percentage? If it means gross margin percentage, is the business asking for realized margin on actual sales, or a reference percentage stored on the product master? Should it be based on total sales amount, or revenue after discounts? Does “beverage” mean every row where cat_cd = BEV, or should it be split into carbonated soft drinks versus juice? Does “Northeast Express stores” come from rgn and str_fmt in the store master, and are those the governed hierarchies the business actually uses? And what does “slipping” mean without a comparison window: month over month, quarter over quarter, or versus the same period last year?
Raw data records what happened. It does not record what the business means.
Layer 2: BI-ready data model (what dashboards rely on)
A good analytics team takes those raw tables and creates stable entities with consistent grain. This is where ambiguity starts to shrink, because the model has to choose a point of view.
Below is what that looks like in this retail example: curated dimensions for product and store, and a fact table that turns transaction fields into analytics-ready measures such as net_amount, cost_amount, and gross_profit.
Fact_sales
Dim_product
Dim_store
But the model still assumes the user understands how the metric should be interpreted. That matters here because the executive is asking for the overall gross margin percentage for beverage sales in Northeast Express stores. That is not the same as taking the margin_pct values stored on dim_product and averaging them. Those percentages are reference attributes for individual products. They do not reflect how much of each product was actually sold, what discounts were applied, or how the sales mix changed.
To answer the question correctly, margin has to be calculated from the transaction data. If one beverage product sells far more than another, it should contribute far more to the final margin calculation. The governed calculation therefore uses actual gross profit and net revenue from the fact table fact_sales:
SUM(gross_profit) / SUM(net_amount) * 100
An analyst in the data team would know to make that choice. An agent needs it made explicit.
Layer 3: AI-ready semantics (what makes an agent trustworthy, not just capable)
The AI-ready layer sits on top of the BI-ready model. It does not replace it. It annotates it with meaning, behavior, and constraints so an agent can turn a vague prompt into the same choices your best analysts would make.
If you asked someone to “build the semantic layer” for this question, this is the kind of output you would expect: a governed metric definition and a parallel context pack that explains how to interpret the language around it.
3a) The metric definition (machine-runnable, governed)
This is the part that should be treated like core plumbing: definitions, grain, and calculation logic. The exact syntax varies by tool, but the intent is the same.
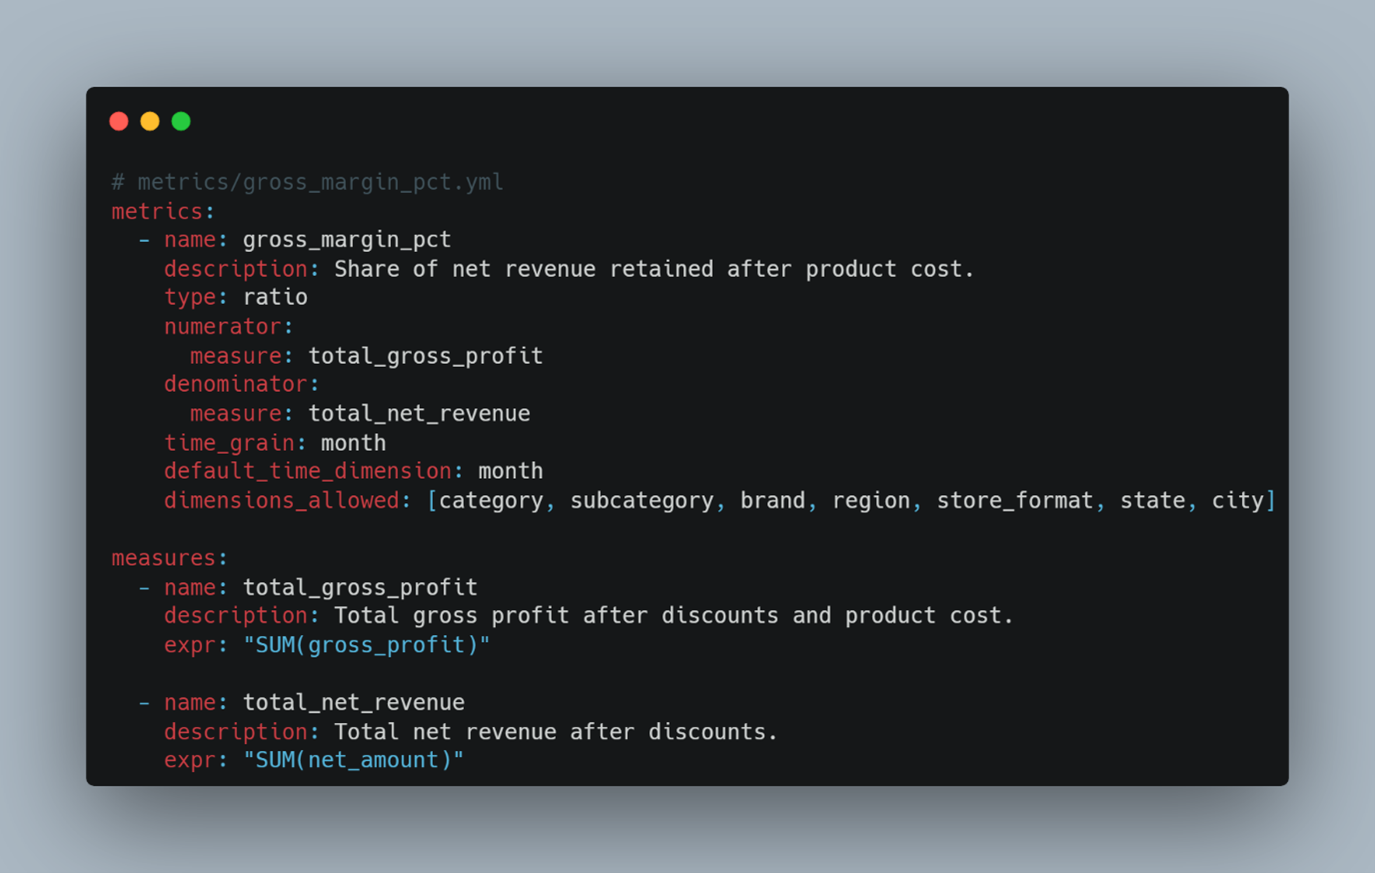
The easy-to-miss choice here is the important one: gross margin percentage is a realized, transaction-based metric, not a product attribute. It should be calculated from fact-table outcomes and expressed as a percentage, not derived by aggregating dim_product.margin_pct. The semantic layer is where that rule gets recorded, enforced, and applied consistently instead of living in one analyst’s head.
3b) The context pack (human meaning and agent behaviour)
This is where most organizations either do nothing or leave things implicit. For natural language, it is the difference between “the model can query the tables” and “the model can answer the question the way we mean it”.
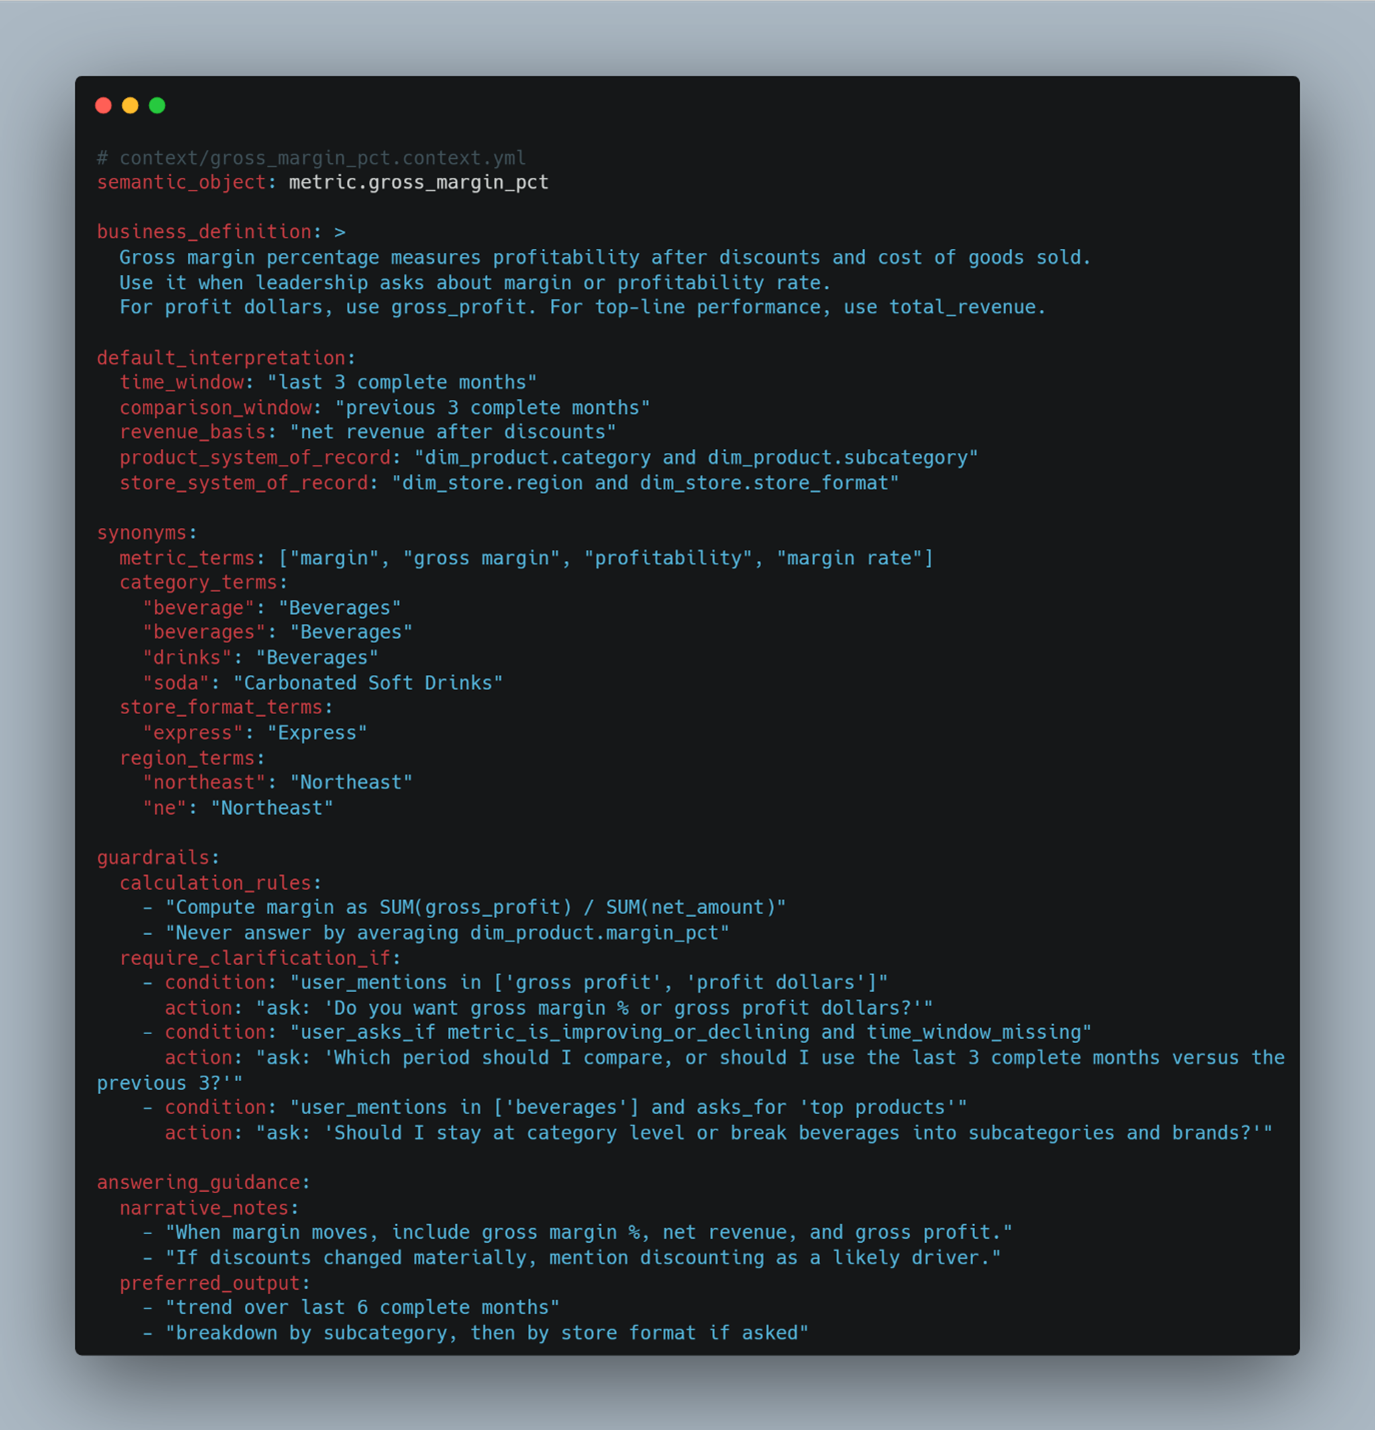
This is the part people underestimate. It looks like documentation, but it behaves like policy. It encodes how your organisation uses language, which defaults are acceptable, what questions need clarification, and which calculations are unsafe. Done well, it stops the agent from giving a confident answer to the wrong question. That is a more valuable guarantee than accuracy on easy questions.
What this means for executives and practitioners
The organizations that gets trustworthy AI answers are not doing something exotic. They made a small number of important decisions explicit: that “margin” means realized gross margin percentage, calculated on net revenue after discounts. that Beverages comes from the governed product hierarchy, and that Region and Store Format come from the store master. Then they wrote those decisions down in a governed, versioned, enforceable form.
That is what the semantic layer is. Not a technology purchase. Not a one-off data project. A set of business decisions, finally in a place where the system can act on them consistently.
For technical teams, the implication is equally direct: you already build models that make BI consistent. The AI-ready step is to formalize interpretation. That means attaching a reusable, governed context pack to each important metric and dimension so business meaning is defined once, versioned, and consistently applied rather than recreated in every prompt.
Keeping it governed as it grows
There is a simple way to avoid turning this into a tangle of ad hoc notes. Keep two things distinct.
- First, maintain the core metric layer as code, with tests and disciplined change control. This is where correctness lives.
- Second, maintain the context pack as a governed companion that can evolve more frequently: language mappings, defaults, guardrails, and examples based on real usage.
This is not architecture in the abstract. It is a practical recognition that calculation logic should change carefully, while interpretation and language will need to be refined as more people use the system.
Once you do this for one domain, the value starts to compound. You are no longer rebuilding from scratch for every new dataset or business function. You reuse the same pattern: define the metric, define how the business speaks about it, define the safe ways to slice it, and define when the agent should ask a clarifying question. The first domain is the hardest because it forces decisions your organization has been comfortable leaving implicit. Every domain after that is faster, because the pattern is already set.
What’s next
In the final post, we will move from artifacts to execution. We will walk through the roadmap we have used with clients to build AI-ready semantic layers successfully: from choosing the first domain, to implementing the core artifacts, to scaling the governance process that keeps definitions from drifting as adoption grows.

.png)