For years, organizations have invested in business intelligence platforms to democratize access to data. Yet despite this investment, many users still face two common challenges:
- Understanding what the data is telling them
- Knowing where to investigate next
Traditional dashboards excel at visualizing information, but they leave contextual interpretation to the user and limit their ability to explore beyond the borders defined by the original developer. They therefore fall short of the primary goal of directly providing actionable insight. At best, they end up serving as a useful starting point for further analysis, and at worst, the shortfall leads them to be ignored altogether.
Generative AI can change that.
Rather than simply helping organizations build dashboards faster, AI is creating opportunities to fundamentally improve how users consume and interact with business intelligence. Two use cases are emerging as particularly impactful, and both point to the same larger shift: moving dashboards from passive tools that place the burden of interpretation on the user to active systems that surface and explain insights to support faster, more confident decisions.
1. Automated Summary Insights: Turning Charts into Narratives
Most dashboards present users with charts, KPIs, and visual indicators. While these visualizations provide the starting point for useful information, they rarely contain enough context for a user to determine if that information is a valuable, actionable insight.
A sales chart may show declining revenue. A customer retention dashboard may highlight a spike in churn. An operations dashboard may reveal an increase in processing times. Often, these observations represent the starting point of the analytics process, where a user is still required to interpret what they’re seeing and formulate their own hypotheses about the underlying drivers. They must piece together different components of a dashboard or apply different filters and parameters to test theories. This is often cumbersome and an unreliable analytical process.
Generative AI can bridge this gap through insight generation.
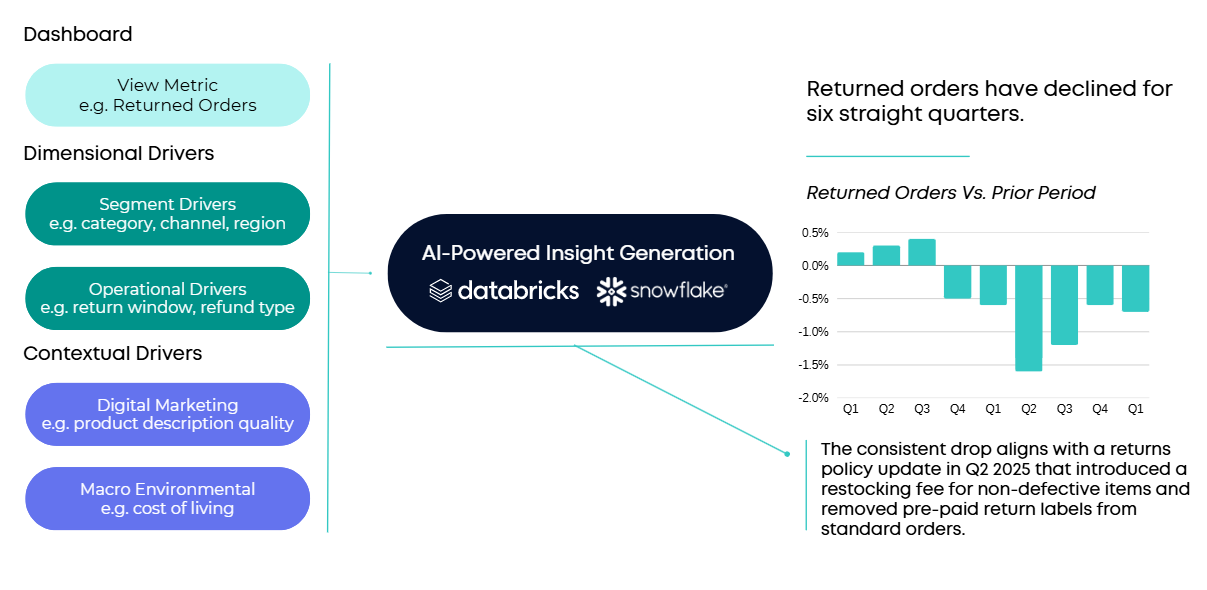
By analyzing dashboard metrics, trends, and underlying data, AI can automatically generate contextual summaries that accompany visualizations. Instead of simply displaying a chart, the dashboard can explain:
- What has changed
- Whether the change is significant
- What factors may be contributing to the trend
- Which segments, products, or regions are most impacted
- What actions may warrant further investigation
This transforms dashboards from passive reporting tools into active analytical assistants.
For business users, this reduces the time spent interpreting data and helps ensure important trends are not overlooked. For organizations, it enables more consistent insight generation across teams, regardless of an individual’s analytical expertise or bandwidth.
2. AI-Powered Drilldowns: Rethinking Dashboard Exploration
The second opportunity lies in how users explore data.
Traditional dashboard design requires developers to anticipate how users will investigate a problem. This often leads to predefined drill paths:
- Revenue by category
- Then by sub-category
- Then by product
While useful, these drilldowns are inherently limited. Developers must decide in advance which questions users might ask, and inevitably, some paths are missed.
The challenge becomes even greater as data models grow more complex and user needs become more diverse.
Generative AI offers a fundamentally different approach.
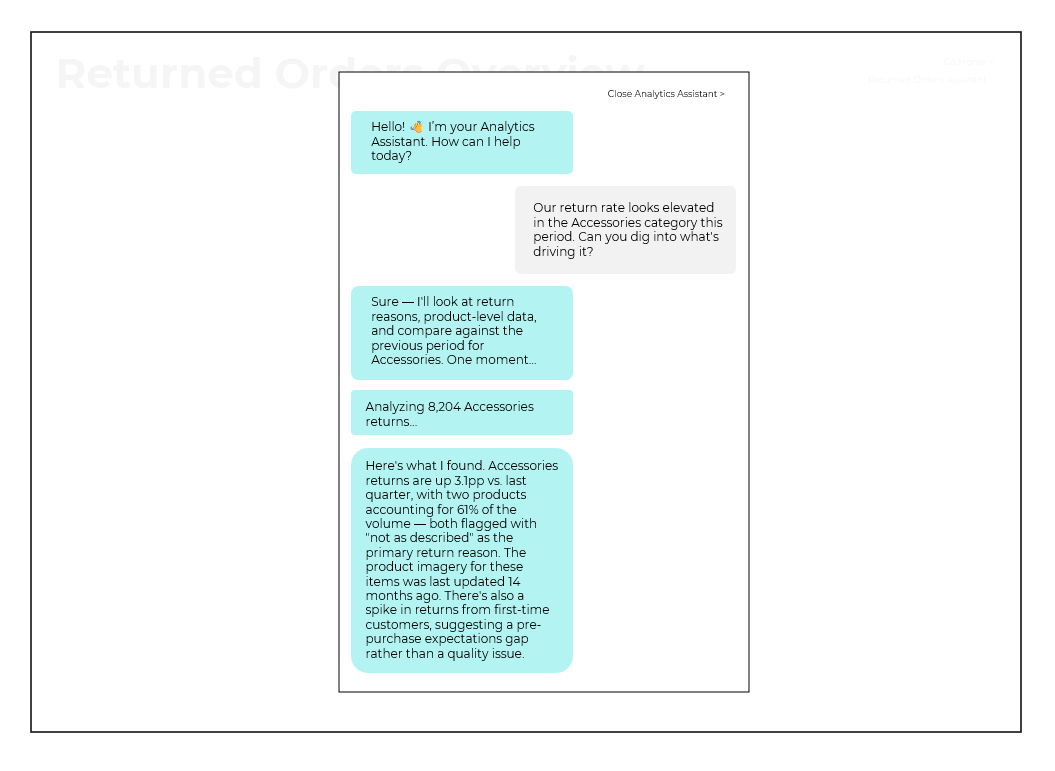
Instead of relying exclusively on predefined drill paths, organizations can embed conversational analytics capabilities such as Databricks Genie or Snowflake CoWork directly within the dashboard experience.
When users identify an anomaly or trend, they can simply ask questions in natural language:
- Why did revenue decline last month?
- Which products contributed most to the decrease?
- How does this compare with the same period last year?
- Is this trend concentrated within a particular customer segment?
Rather than navigating a rigid hierarchy of filters and drilldowns, users can investigate data dynamically based on their own line of questioning.
This approach delivers several advantages:
- Faster root-cause analysis
- Greater analytical flexibility
- Less reliance on developers to anticipate every possible exploration path
- More intuitive data exploration
Most importantly, it allows dashboards to evolve from static reporting interfaces into conversational analytical experiences. Users are no longer limited by what the dashboard designer originally created. When well executed, the new conversational interface enabled by AI is more than just a facelift or a gimmick to emulate the popular appeal of ChatGPT. This new paradigm is a better fit for the kind of iterative analysis users often need: asking follow-up questions, testing hypotheses, narrowing in on drivers, and moving beyond surface-level observations to uncover true insight.
The Future of Data Engagement
Business intelligence has already undergone waves of change over the past two decades. While business intelligence was originally limited to technical teams that served as data gatekeepers and fielded ad hoc requests, the first wave of self-service analytics gave users access to data so they could conduct their own analysis. They were also equipped with tools that promised to make it simpler for them to derive valuable insights: the interactive dashboard, typically created by a centralized team, has been the focal point of business intelligence efforts in this wave.
However, reality often fell short of the vision. The next AI-enabled phase of change will enhance self-service capability by solving the main limitations of the previous era. AI-generated insights provide immediate context and explanation, and conversational drilldowns empower users to investigate without being constrained by predefined dashboard design.
Together, these capabilities shift the role of dashboards from information delivery to decision support. And by lowering the barrier to entry for interrogating and interpreting the data, more users will be able to consistently derive genuine insights and make data-driven decisions.
How We Can Help
Implementing AI-powered business intelligence requires more than simply enabling a new feature within a dashboard. Success depends on a combination of business alignment, trusted data foundations, semantic modeling, AI configuration, and ongoing optimization.
At Aimpoint Digital, we help organizations deliver AI-enabled analytics across the full lifecycle, from identifying high-value use cases and defining business outcomes to designing the semantic layer, configuring agents, validating with users, integrating with front-end systems, and enabling continuous improvement.
If you're looking to maximize the value of your data and AI investments through intelligent analytics, conversational business intelligence, and AI-powered insights, reach out to the Aimpoint Digital team to learn how we can help.

.png)