.png)
Introduction
Dashboard usage usually follows predictable patterns—spiking during business hours and dropping off overnight. For organizations running Sigma dashboards on Databricks, recognizing these usage trends is essential to controlling compute costs while still ensuring fast, reliable performance for end users.
Different types of Databricks SQL warehouses are suited for different workloads: serverless options start quickly and work well for on-demand access but cost more per minute, while pro SQL warehouses take longer to start but offer a lower ongoing rate. By aligning warehouse choices and schedules with actual Sigma usage, you can reduce unnecessary Databricks compute spend without sacrificing dashboard responsiveness.
Understanding the Sigma + Databricks integration
Sigma allows users to create dashboards and data apps with a spreadsheet-like interface without managing data pipelines or refresh schedules. Every interaction with a Sigma dashboard sends live queries to the underlying data warehouse—in this case, Databricks.
While this real-time querying model eliminates the need to orchestrate BI data refreshes, it introduces a tradeoff: compute spins up with every dashboard load, even if the underlying data hasn’t changed. This can result in unnecessary compute costs if not managed carefully.
Notably, Sigma does not currently support dynamic switching between clusters or warehouses. Once connected, it uses the same Databricks SQL warehouse around the clock, making it even more important to choose the right compute configuration and schedule.
Choosing the right Databricks compute for your workload
Databricks offers three different options for SQL warehouses:
- Serverless SQL warehouses are fully managed by Databricks and optimized for fast startup (2-6 seconds). Serverless warehouses come at a higher per-minute cost than the other warehouse types, but offer quick downscaling to minimize costs when demand is low. This is the recommended option for on-demand, interactive dashboard usage.
- Pro SQL warehouses run within your cloud infrastructure. These take longer to start (typically ~4 minutes) and scale up and down with less responsiveness than a serverless SQL warehouse. These warehouses could be a good fit for always-on scenarios, given their lower per-minute cost than serverless warehouses.
- Classic SQL warehouses offer fewer performance benefits than either serverless or pro and would not be recommended for a Sigma use case.
In most scenarios, we recommend serverless for Sigma due to its responsiveness and simplicity, especially when paired with intelligent scheduling to minimize idle time costs.
Beyond the type of warehouse, your configuration options could impact the cost and performance of your Sigma dashboards. When determining the size of your warehouse, consider when it may be right to scale up (i.e., choose a larger warehouse size) and when you need to scale out (i.e., increase the number of clusters within the warehouse).
- Scaling up (with larger instance sizes) is best for complex queries or large datasets that require more CPU and memory per node.
- Scaling out (with more clusters) is useful for handling high concurrency and parallel query execution. You can enable autoscaling in your SQL warehouse to let Databricks dynamically add or remove clusters based on the workload, within a minimum and maximum number of clusters that you specify.
You can use information available in Databricks and Sigma logs to identify scenarios when you might need to scale up or out. To find this data, you can check your SQL warehouse’s monitoring tab, query history, and audit logs or cluster logs.
Signs that you may need to scale up:
- High query execution time despite low concurrency (low concurrency = not many queries happening at the same time)
- Long task durations in the query profile
- Frequent spilling to disk (which indicates memory pressure)
- CPU or memory saturation per node
- High shuffle read/write times
Signs you may need to scale out:
- Query queuing or delays before execution starts
- Low CPU/memory usage per node, but many queries waiting
- Dashboards slow only during peak user times
Use this performance data in conjunction with dashboard usage patterns (e.g., from Sigma or access logs) to align compute configuration with both the nature of the workload and user demand.
Analyzing usage patterns to fine-tune compute scheduling
In most organizations, BI platforms experience predictable demand, with daytime peaks and reduced usage during nights and weekends. These insights help inform smarter compute scheduling decisions. Below is a typical usage curve:
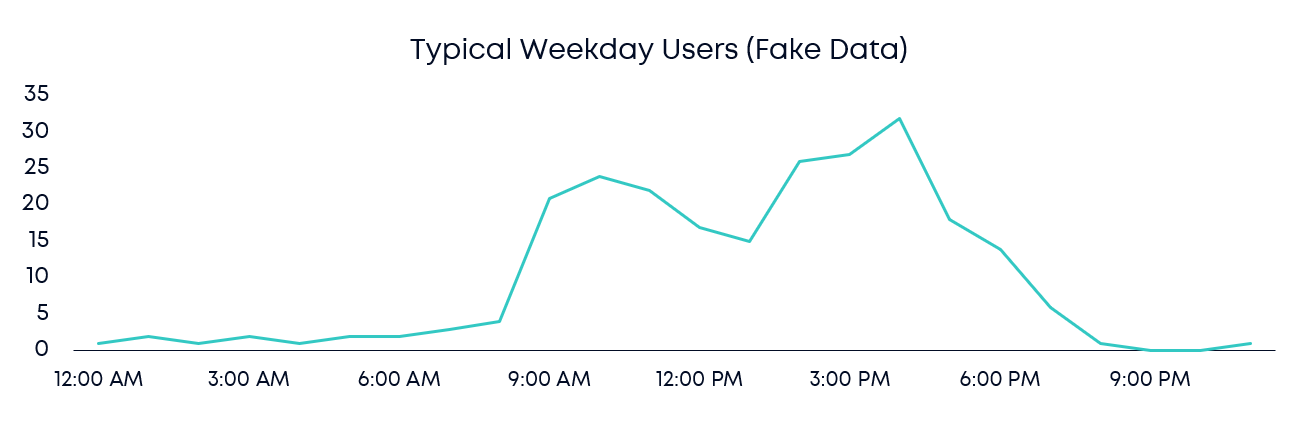
This schedule can cause organizations to overpay for compute during lulls, or under-provision compute and force peak users to endure slow load times.
Determining your user schedule
Sigma has built-in usage dashboards for admins showing data including median query duration, average query duration, and query performance trends. Sigma also offers an audit log feature, which can be used to build custom dashboards on query executions and other user-initiated events. Databricks also maintains detailed logs at the SQL warehouse level, which could provide query start and end times, execution durations, the cluster used, and queuing times. Cross-referencing these logs with Sigma activity allows for a more granular understanding of how compute is being used and where it’s over- or under-provisioned.
Understanding usage patterns
Once you’ve collected the usage data from Sigma and Databricks, you can use a variety of analytical techniques to reveal patterns. Your analysis could include:
- Calculating the average and 90th percentile query duration by hour to determine when performance bottlenecks occur
- Identifying periods of high user overlap
- Segmenting dashboards by underlying data size or query cost
- Using heatmaps to visualize usage by hour and day
Example insight:
You might find that there are 20 people interacting with a dashboard built on tiny tables in the morning but 5 people are interacting with a dashboard on huge tables in the afternoon. In the morning, you might need to scale out by ensuring your autoscaling is properly configured with enough max clusters. In the afternoon, you might need to scale up, increasing the warehouse size to be able to handle those larger datasets.
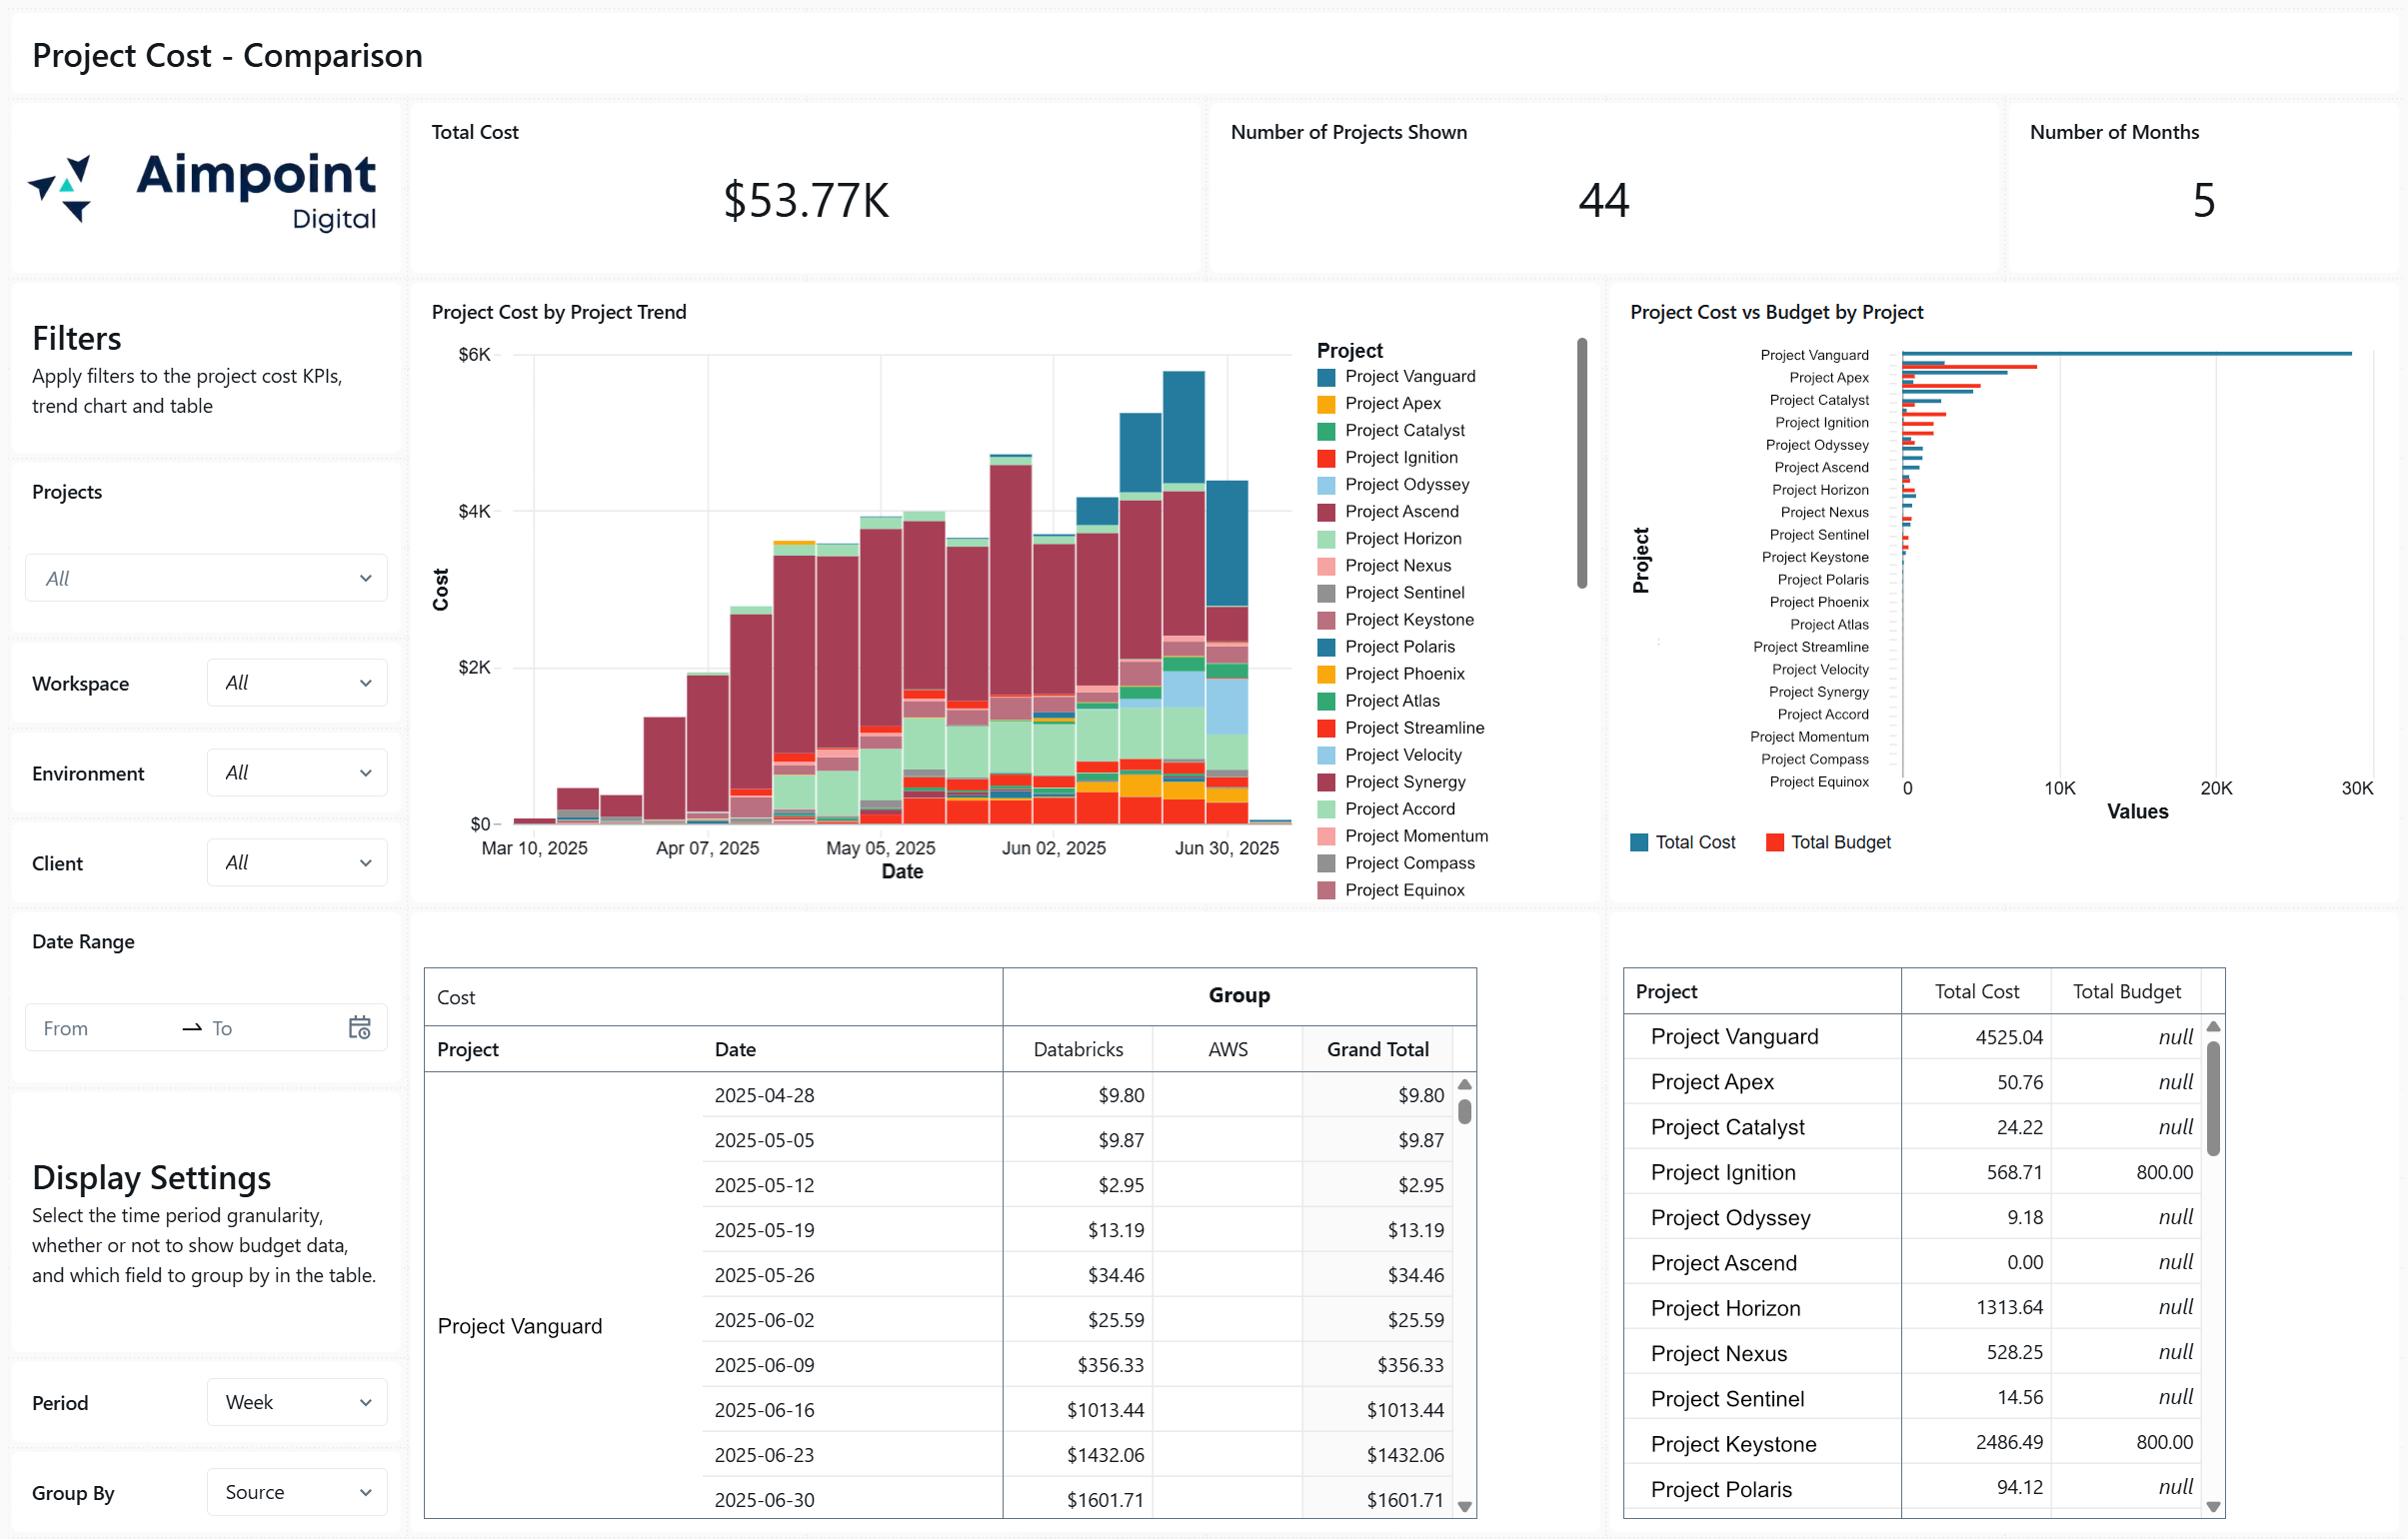
Cost Visibility and Monitoring
As you work to optimize your Databricks compute costs, you’ll want to ensure that you’re properly tracking warehouse costs. Databricks allows you to monitor warehouse usage and costs by importing pre-built usage dashboards to your workspaces. To further improve visibility, tag each warehouse with metadata (e.g., business unit).
We’ve helped clients build custom FinOps dashboards that track Databricks usage and cost down to the dashboard, team, or even individual user. Interested in building your own FinOps dashboard? Reach out—we’d be happy to show you a demo.
Key takeaways for optimizing Databricks compute costs in Sigma
To wrap up, we recommend:
- Use serverless SQL warehouses by default for responsive dashboards, but consider pro warehouses if you need always-on compute.
- Right-size your compute based on the nature of your Sigma workloads
- Leverage usage data from Sigma and Databricks logs to inform scaling and scheduling decisions
- Consider using different compute for different times of day
- Monitor and iterate continuously with FinOps dashboards to track costs by team, dashboard, or user
As a market-leading Sigma partner and 2x Databricks Digital Native Partner of the Year winner, our expert team can help you optimize your Sigma dashboards and leverage the full potential of Sigma and Databricks.
.png)

.png)