
Why this matters
Imagine you run a pizza shop and sell slices for $3. Business is steady. One day, you raise the price to $3.15 (just 15 cents). Suddenly, sales have dropped more than you expected. What might have happened?
Prices are a signal that can influence what people do, although we don’t respond to them in a vacuum. We might compare prices to those of a competing product or what we can do with our money instead if we spend it elsewhere (a.k.a. opportunity cost). As a business, understanding the decisions your customers make, how sensitive your customers are to price, as well as what factors impact their sensitivity not only leads to greater profitability and revenue, but may also help you:
- Analyze different pricing strategies to see what works best
- Plan better promotions (and know when to stop discounting)
- Order the right amount of inventory
- Avoid surprising customers or damaging your brand
- Compete without racing to the bottom
Big companies like Amazon and Uber spend millions perfecting this. But the idea behind it is simple and can be executed by businesses of any size.
What is price elasticity?
Think of demand like pizza dough. Warm dough stretches a lot with a little effort; cold dough is stiff and doesn’t pull apart easy. Price elasticity tells you how much demand “stretches” when price changes.
In short: Elasticity = the expected % change in units sold when price changes by 1%. We can categorize elasticity into a few groups:
- Elastic demand (stretchy): A price change causes a relatively bigger change in sales, where we will know demand is elastic if the elasticity is less than -1 (e.g. -2).
- Inelastic demand (stiff): A price change causes a relatively smaller change in sales, where we would consider demand inelastic if the elasticity is greater than -1 (e.g. -0.8).
- Unit elastic demand (balanced): A price change causes a similar change in sales, which we’ll know demand is unit elastic if the elasticity is equal to -1.
Examples:
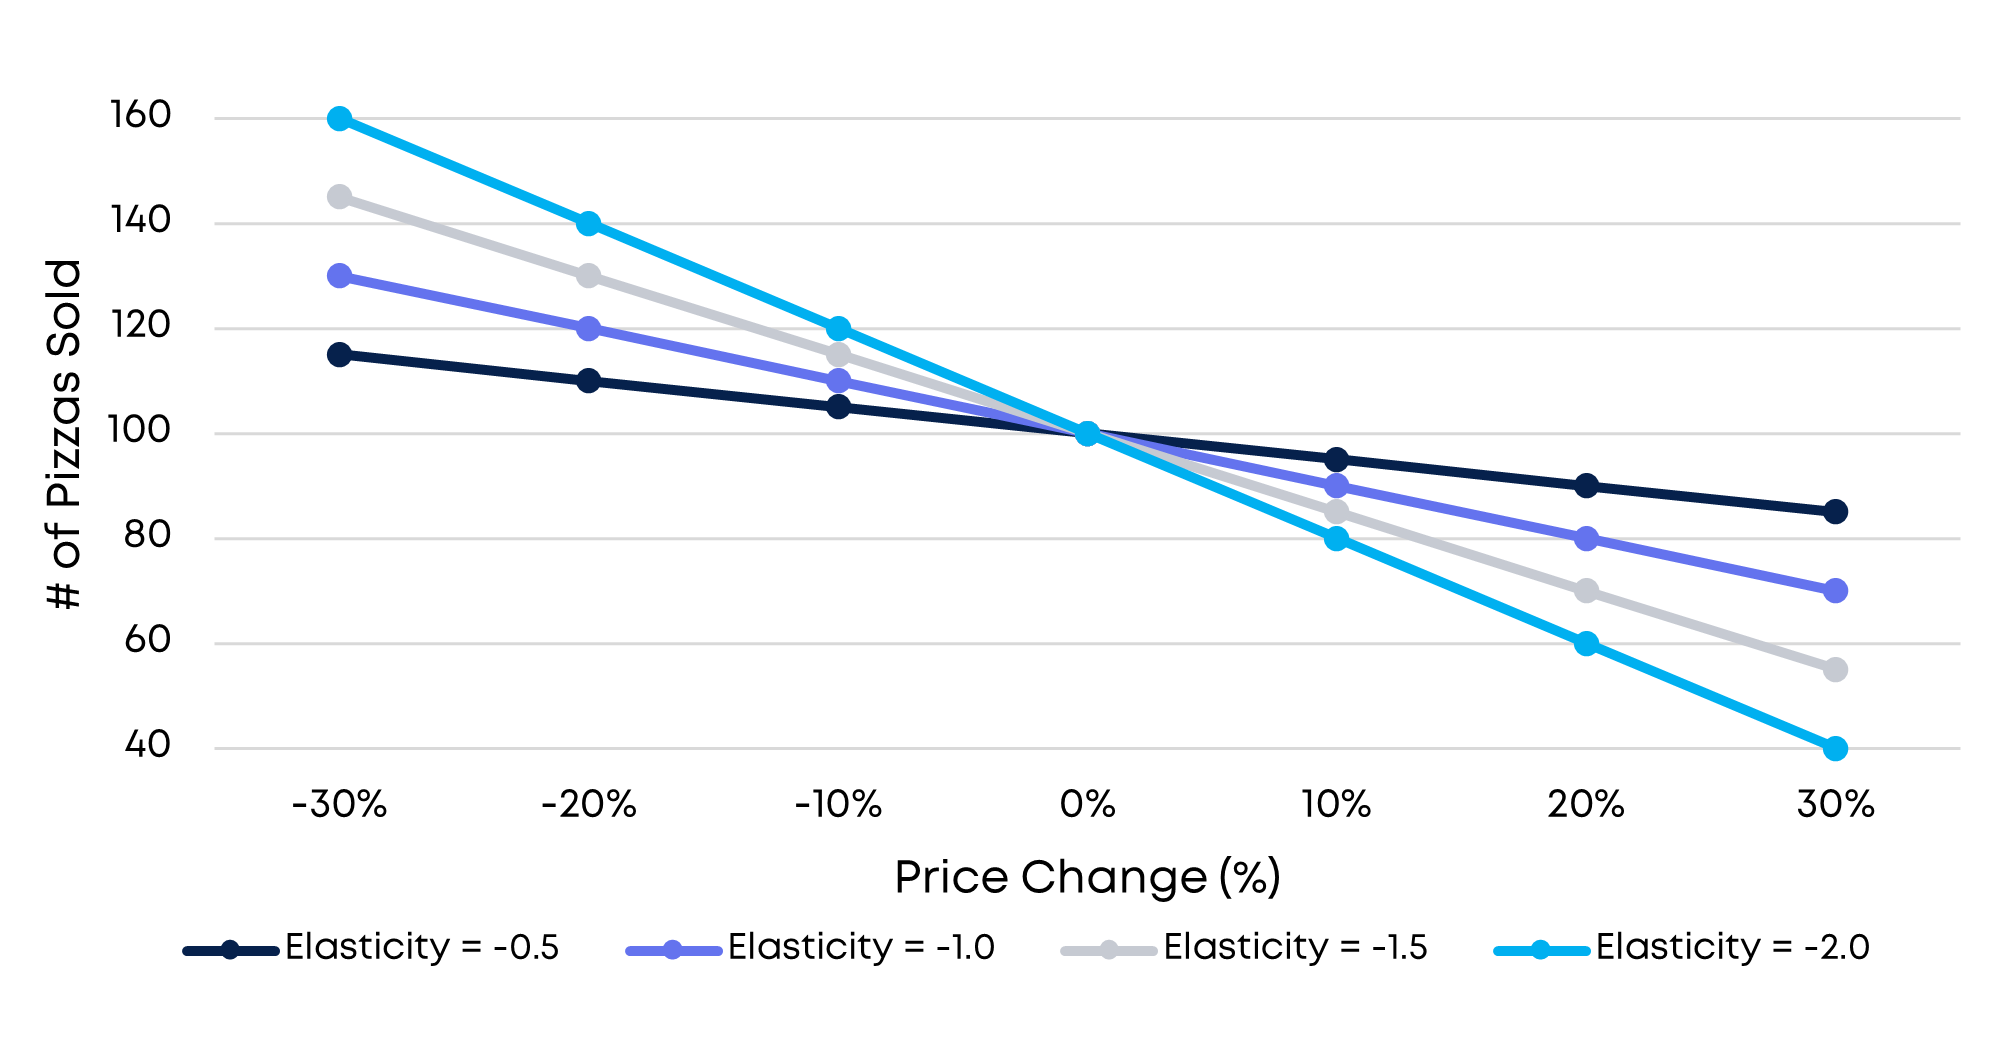
- Elasticity = -0.5: Raise price 1% → # of slices sold drop about 0.5%. In other words, if you sold 200 slices of pizza at $3 a slice before, then adding 30 cents to the price (10% increase) should reduce demand to 190 slices (10 slices or 5% decrease).
- Elasticity = -2.0: Lower price 1% → # of slices sold go up about 2.0%. In other words, if you sold 200 slices of pizza at $3 a slice before, then take 30 cents off the price (10% decrease) should increase demand to 240 slices (40 slices or 20% increase).
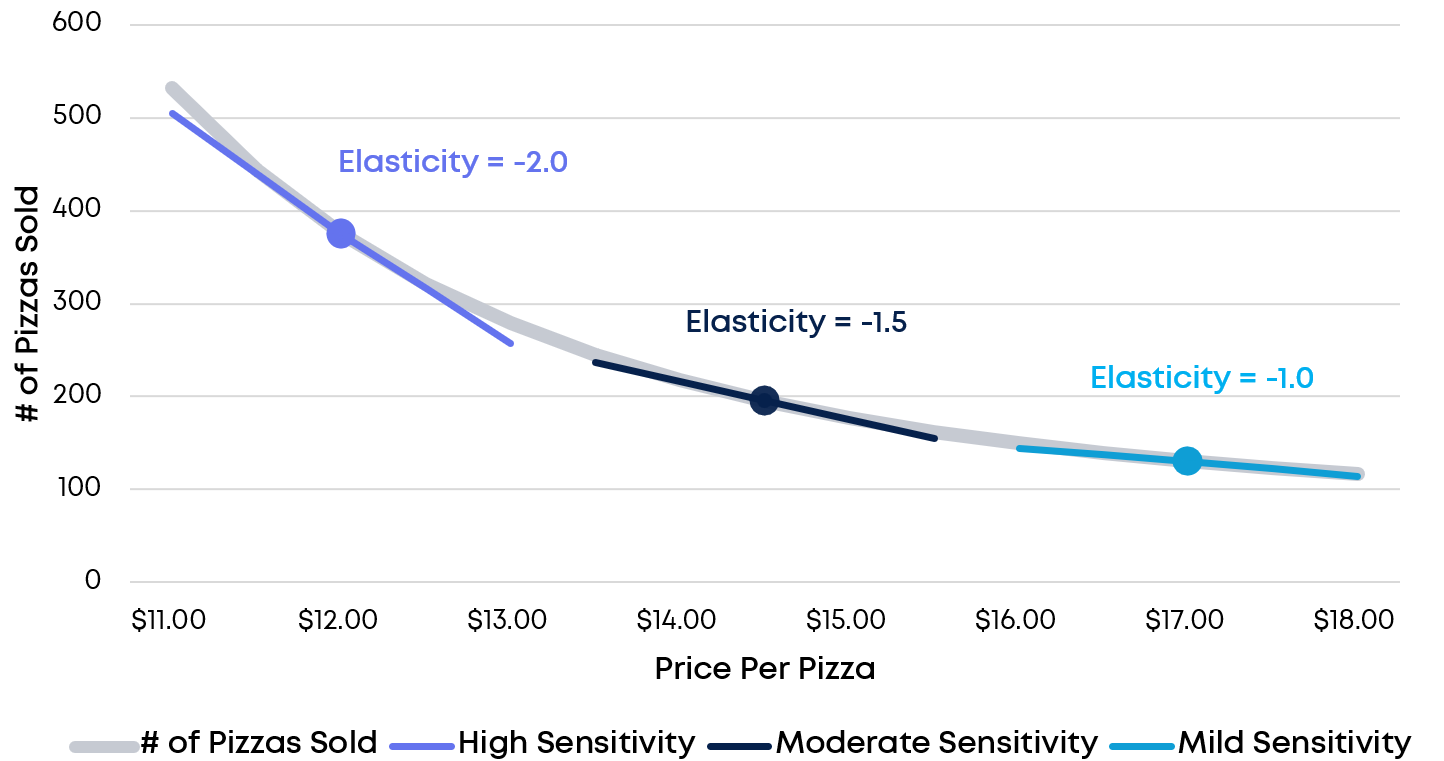
Note: People who study elasticity often report it as a negative number because higher prices usually results in lower sales. We also find that the same product can have different amounts of stretchiness as we move to higher or lower price regions, as shown below:
How do you measure elasticity without a degree in economics?
You don’t need fancy math to get useful answers. Start simple and get more advanced only if you need to.
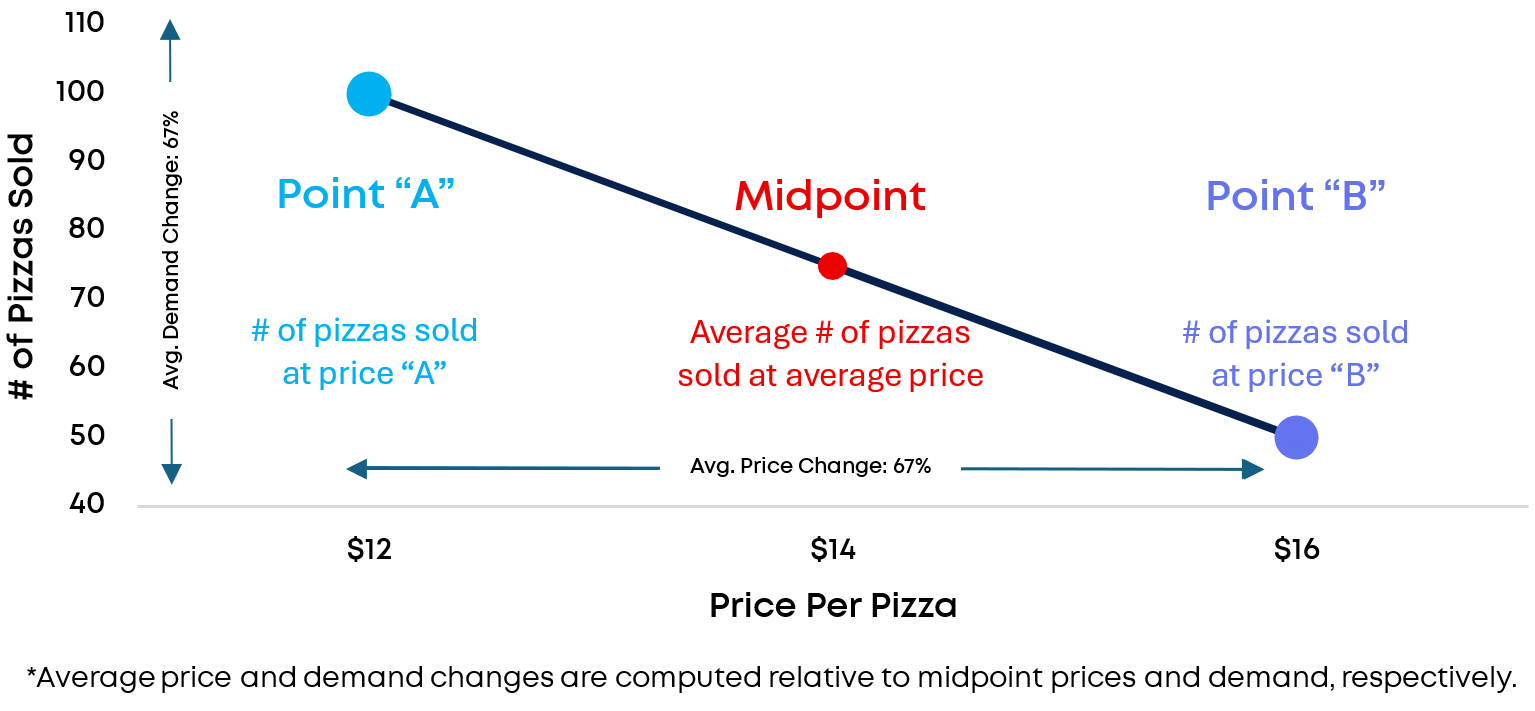
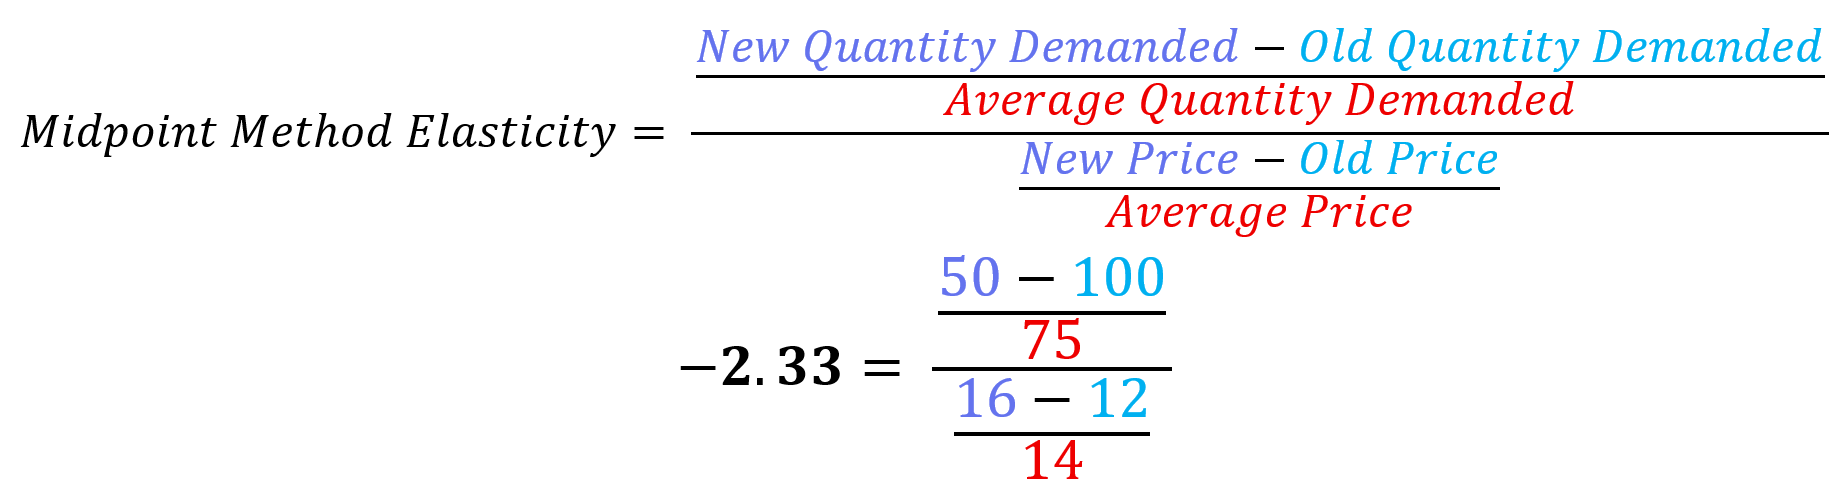
- Quick check (midpoint method)
- Pick two points in time when the price was different.
- See how much price changed (%) and how much sales changed (%) relative to the average (midpoint) price and sales.
- Elasticity ≈ percent change in sales divided by percent change in price. Good for a rough sense. Not perfect because other things may have changed too (season, ads, weather).
- Small experiments (A/B testing)
- Try two prices for the same product at the same time (different days, locations, or audiences).
- Keep everything else as similar as possible.
- Compare sales and revenue. Pro: More accurate than a quick check. Con: Takes planning, and you must be fair and follow pricing laws and platform rules.
Note: Revenue is price × quantity. Profit also depends on costs.
- Use your past sales data (the practical workhorse)
- Look at many weeks or months of sales alongside price.
- Note other factors: day of week, holidays, paydays, weather, ads, competitor prices.
- Use simple tools (spreadsheets or basic analytics) to see patterns. Pro: Uses data you already have. Con: You need multiple price changes and should control for outside factors.
Where elasticity estimation fails:
- Seasonality: Pizza sells more during winter even if prices don’t change.
- Promotions: A free cannoli coupon plus a pizza price cut isn’t just a price change.
- Stockouts: Running out of pizza dough mid-day might make demand look “low” even if people wanted to buy.
- One-off events: Pizza sales spike on Super Bowl Sunday and other holidays. Try to note these so you don’t blame price for everything.
- Event-driven-actions: If price changes are direct responses to increasing or decreasing demand, then it becomes hard to distinguish between general changes in demand and shifts in price.
Don’t forget how products influence each other (cross-price elasticity)

Customers do not view products and prices in a vacuum, going back to the pizza shop example:
Substitutes: If the price of a 12oz bottle of Coca-Cola goes up relative to Pepsi, customers might substitute from Coke to Pepsi. This portion of the change in demand is called the substitution effect.
Complements: If customers tend to consume Coca-Cola with their pizza, the increase in the cost of Coca-Cola might drive them to purchase less pizza since the total cost of lunch has gone up.
If we’re trying to calculate the cross-price elasticity, let’s say for Coke, we will simply look at how a price change for Pepsi will impact the amount of Coke sold.

Why this matters:
- If you discount a substitute, you might steal sales from your own similar product.
- If you discount a complement, you might sell more of the pair (e.g., game console + games).
How to spot relationships
- Basket analysis: Which items are bought together?
- Simple correlations over time: When A goes up, does B go down?
- Category thinking: Group related items (e.g., sodas, chips) and plan pricing by group, not item by item, to keep it manageable.
Bottom line
Price elasticity is just a practical way to answer: “If we change the price, what happens to sales and profit?” Start simple, measure carefully, and build from there. Even small, thoughtful changes—guided by elasticity—can unlock meaningful gains without risking customer trust.
If you want to go further
As your business and catalog grow, smarter models can capture complex patterns (like non-linear effects of temperature on ice cream sales), improving the accuracy of elasticity estimates. If you don’t have this in-house, a data partner like Aimpoint Digital can help—but don’t wait for perfect; simple steps still yield valuable insights. When you’re ready to scale, tools like Aimpoint Digital’s Promotion Price Optimization App let you adjust prices faster while incorporating more signals (inventory, competitors, time of day, product relationships). The goal remains the same: estimate price sensitivity, set smart rules, test, and iterate.


.png)
.png)