
The previous blog post, The Case for Causality, discussed the basics of causal thinking and how to include it in your analysis. In this blog, we will detail the benefits businesses can gain from causal thinking.
Causal inference is useful in scenarios where there are many factors that affect an outcome. This is why causal inference is particularly helpful in situations about decisions around people (e.g., customers, users, and employees) and their behavior. Given this, here are industry examples of where it can be applied to improve business outcomes:
- Tech: testing and optimizing product features, recommendations, and user experiences
- Healthcare: identifying the effect of new clinical recommendations, new insurer coverage policies, and treatments on patient outcomes
- Finance: accurately assessing credit risk, impact of trades, and impact of tax policies on the economy
- Marketing: measuring impact of advertising budget and allocation, efficacy of ad campaigns, and promotion personalization
Our Toy Example: Ice Cream Shop Marketing
To see the value in applying causal inference, let us return to the previous example about an ice cream shop. Every year the marketing team holds promotions during the summer given it is the season with the highest demand. Additionally, the team has historically used local pool attendance to decide when to run a promotion.
High pool attendance meant HIGH DEMAND!

However, the owners were unsure if promotions during high pool attendance is even the best strategy. The current personalization strategy was to target people who went to the local pools. While logically sound, it did not allow for strategies that extended to other potential customers. Hence, the owners wanted to know:
- Does the current promotion strategy affect the sales of various customer subgroups differently?
- If so, which subgroups should they target?
- How should they personalize the marketing strategy to target customer subgroups?
The owners might try to answer these questions through an intuitive analytical approach that is based on descriptive statistics. For example, they could identify the most frequent subgroups to form a targeted marketing strategy. This decision might be directionally accurate, but it does not tell them:
- What are the influences that attract the shop’s most frequent subgroup? Is it the type of ice cream shop itself or the shop’s proximity to other stores (i.e. a new nail salon or playground)?
- How much should the owners invest in the personalized marketing strategy?
- After implementation, how do we determine whether the new strategy was a success? What was the strategy’s ROI?
To answer these questions from a causal perspective, we first begin with the most crucial step, setting up the problem:
- Causal hypothesis (question): this specifies the outcome (or metric) of interest and the intervention whose effect we are trying to measure – Do promotions during high pool attendance days increase sales?
- Is there a time component? If the outcome is seasonal or the intervention happened at a specific point in time, we must incorporate that into the problem – We can compare the sales of the previous summer (before the new marketing strategy) to the current summer (after the new marketing strategy)
- What might drive changes in both outcome and / or treatment? Variables that impact both are called confounders, variables that impact one or the other are controls – A Directed Acyclic Graph (DAG) can help visualize this
- Do we have the right data? Our data should track our outcome over time, who or what got the treatment and when it happened, as well as confounding variables before and after the intervention
The Directed Acyclic Graph (DAG)
Expanding on step 3, we develop our DAG, which shows the relationships between the outcome (i.e., demand), confounders, and controls.

For a DAG:
- Each node represents a variable
- Each edge (arrow) from one node to the other infers a dependency of the destination node on the originating node
For example, foot traffic is affected by an event occurring, pool attendance and the weather. On warmer days, more people are likely to both walk around town and go to the pool.
There are cases where our causal assumptions are violated due to relationship dependencies between confounders, interventions and/or outcomes. These cases require special consideration and implementation of additional steps to offset the violations. If interested, a future blog post will discuss these complex cases and the techniques used with them. Fortunately, in our example no such complications exist.
Discovery & Recommendations
Remember, in the original example, the marketing team sets promotions on days of high pool attendance, assuming the pool attendance drives most of the foot traffic. Without causal assessment, we won’t see that weather is the main driver of the demand through pool attendance. We prove this by looking at the sales data of days with higher temperatures but no pool attendance (e.g. when the pool closed for a week due to maintenance or the three days when all the lifeguards caught the same stomach bug).
We begin by noticing that the DAG also suggests that events (e.g. concert, sports event) impact foot traffic. Hence, we performed the following analysis:
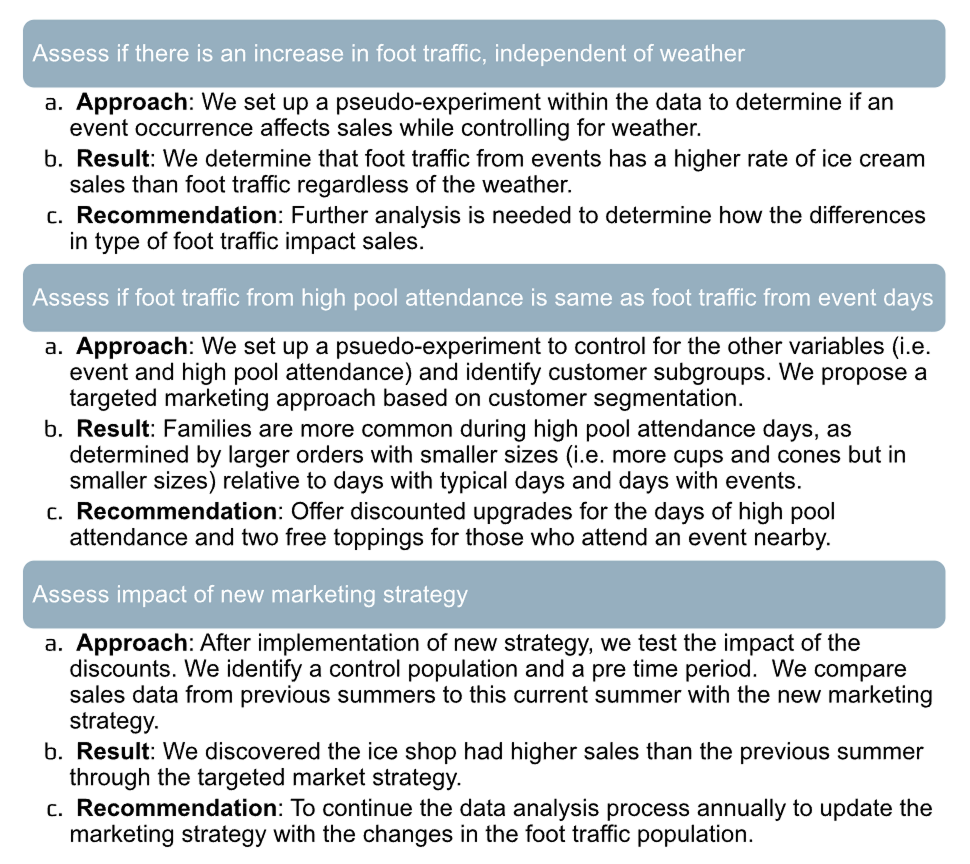
Final Takeaway
DAGs can assist analysts in organizing the dependencies between variables and flagging some problematic relationships. Causal inference approaches improve business decision making through: (1) a better understanding of the impact of various strategies (e.g. promotion, marketing, pricing) and (2) how these various strategies may impact customer segments differently.
Want to learn more? - If causal inference sounds like something that would benefit you, stay tuned for the next upcoming blogs in our Causal Inference Series where we will dive deeper into specific modeling techniques and case studies.

.png)
.png)